I concluded an April 17, 2026, Barchart article on the U.S. dollar index with the following:
While the dollar index could be heading for lower lows, it is likely to remain within the 89.20-114.78 range over the coming months.
The dollar index was trading at 97.78 in April 2026. At near 100 in June 2026, the index was higher, but it remains in a narrow consolidation range.
Consolidation continues
Over the past year, the dollar index has traded in a tight 5.09 point range.
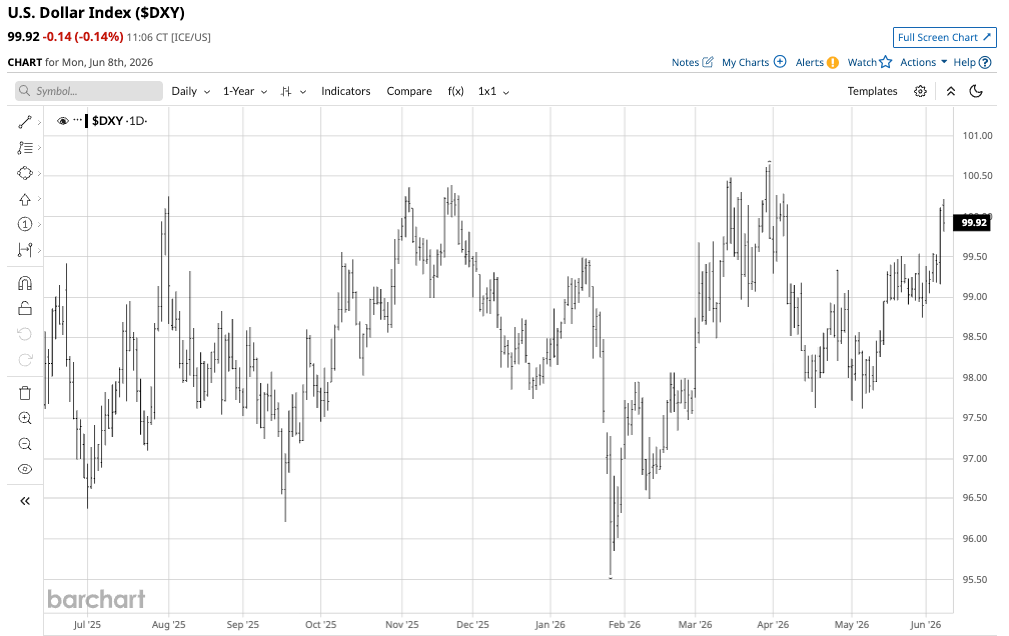
The daily chart shows that the 5.09 range includes a downside extension that took the index to a 95.55 low on January 27, 2026, and an upside extension that pushed it to 100.64 on March 31, 2026. Aside from those extensions, the index has traded in a narrow 4.18 point range over the past year, with the pivot point around 98.50, which is just above the high and low for the past year.
The bullish case for the dollar index
The bullish technical case for the dollar index is evident from its 20-year monthly chart.
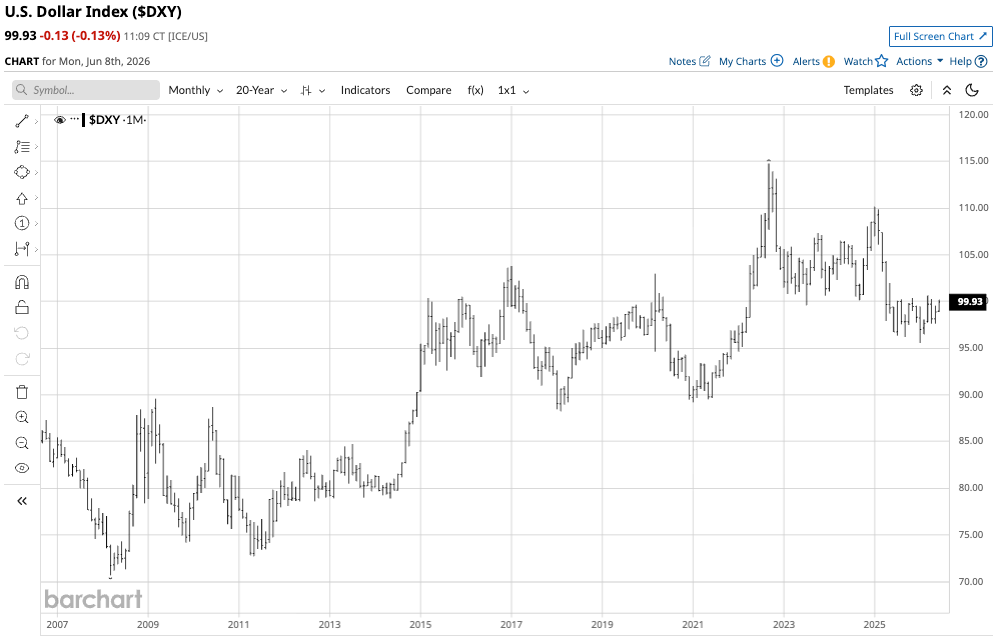
The index has made higher lows and higher highs from the March 2008 low of 70.69 to the September 2022 114.78 high. Since 2008, downside corrections have not declined below the previous critical technical support levels.
Fundamentally, the following factors support the U.S. dollar index, which measures the dollar against the other leading world reserve currencies:
- The U.S. continues to have the leading world economy.
- Elevated U.S. interest rates support the dollar versus other world reserve currencies.
- As the world’s reserve currency, the dollar remains the currency that central banks, governments, and monetary authorities hold as a reserve asset.
- Turbulent times and economic and geopolitical surprises tend to support the dollar as a safe haven.
The 20-year chart and a host of fundamental factors support the dollar index at the 99 level.
The dollar index’s bearish case
The bearish technical case for the dollar index is evident from its long-term quarterly chart.
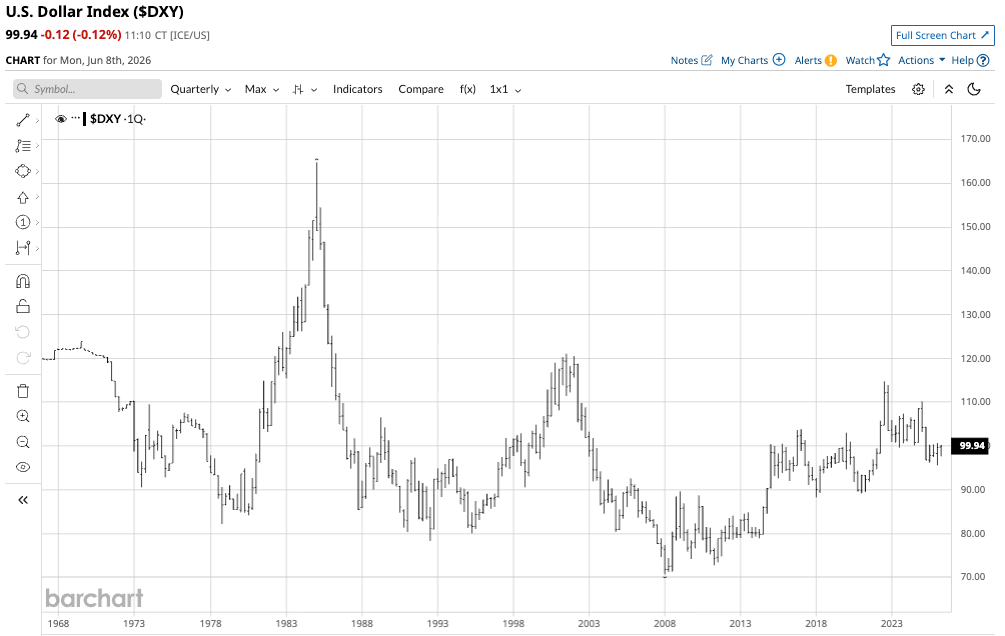
The index has made lower highs and lower lows from the 1985 high of 174.72 to the 2008 low of 70.69. While the index has recovered since 2008, the long-term bearish trend remains intact, as it has not traded above the 2022 high of 114.78.
Fundamentally, the following factors weigh on the U.S. dollar index:
- U.S. debt approaching $40 trillion has impacted the full faith and credit of the U.S. government and its currency.
- Credit agencies have downgraded U.S. credit.
- U.S. tariffs, sanctions, and the bifurcation of the world’s nuclear powers have increased de-dollarization. As other countries turn to the Chinese yuan and other foreign currencies for international trade, it decreases the U.S. dollar’s power in worldwide trade.
- Gold, the world’s oldest currency and means of exchange, has experienced a parabolic rally from $252.50 in 1999 to over $5,600 per ounce in early 2026. At over $4,500 per ounce in June 2026, gold’s ascent is a commentary on fiat currency weakness, and the U.S. dollar is no exception.
- The dollar index measures the U.S. currency against the euro and other leading reserve currencies. U.S. trade policy and relations with allies have weakened the alliances.
The long-term chart and many fundamental factors weigh on the dollar index. The bottom line is that the dollar index is consolidating with bullish and bearish factors pulling it in opposite directions.
Technical levels remain intact
Since 2008, the long-term technical support for the dollar index has been at 70.69, with technical resistance at 114.78, a 44.09 range, and more than 8.5 times the past year's range.
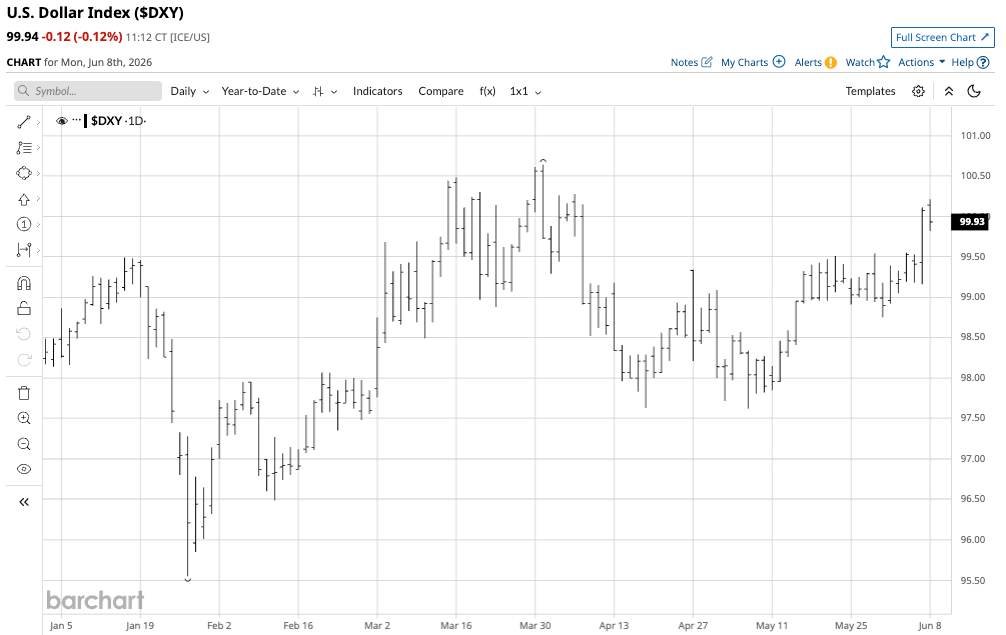
The year-to-date chart shows that the first short-term upside target is the March 31 high of 100.64, with technical support at the May 6 low of 97.62 and the January 27 low of 95.55. A move that takes the index higher than the 2026 high or lower than its low could trigger a substantial move. While ICE offers liquid dollar index futures and futures options, the Invesco DB USD Index Bullish Fund (UUP) moved higher and lower with the U.S. dollar index, while the Invesco DB USD Index Bearish ETF (UDN) moves higher when the index declines and lower when it rallies.
A balanced case favors continued consolidation, favoring higher commodity prices
The strength of competing bullish and bearish factors and technical indicators suggests that the dollar index will remain mostly in its current 95-100 range. However, two factors could push it through technical levels.
On the bearish side, if global de-dollarization accelerates over the coming months and years, it could raise the euro’s profile relative to the dollar. Since the dollar index has a 57.6% exposure to the euro, a strengthening euro versus the U.S. dollar would send the index lower.
From a bullish perspective, the U.S. dollar has been a magnetic force when economic and geopolitical events and surprises occur. The index rallied in early 2020 as the global pandemic gripped all asset classes, and it rallied to highs in 2022 when Russia invaded Ukraine. Most recently, the Middle East hostilities between the U.S./Israel, and Iran caused the dollar to rise to its 2026 high of 100.64 in late March. Any surprises in the economic or geopolitical landscape that drive capital to safe havens will likely benefit the dollar’s value and the dollar index.
Barring any surprises, the index seems trapped in the 95-100 range for the rest of 2026.